
19 Aug On The Map: 2019-08
Over the course of the past 12 months, STPAO GIS has added 4,232 new parcels to the Assessor’s Geographic Information System for an average of 350+ new parcels added per month. At that rate, we should pass 100,000 Assessment Numbers mapped (parcels and points) by next August!
Here is a deeper look at the parcel capture from August 2018 to August 2019:
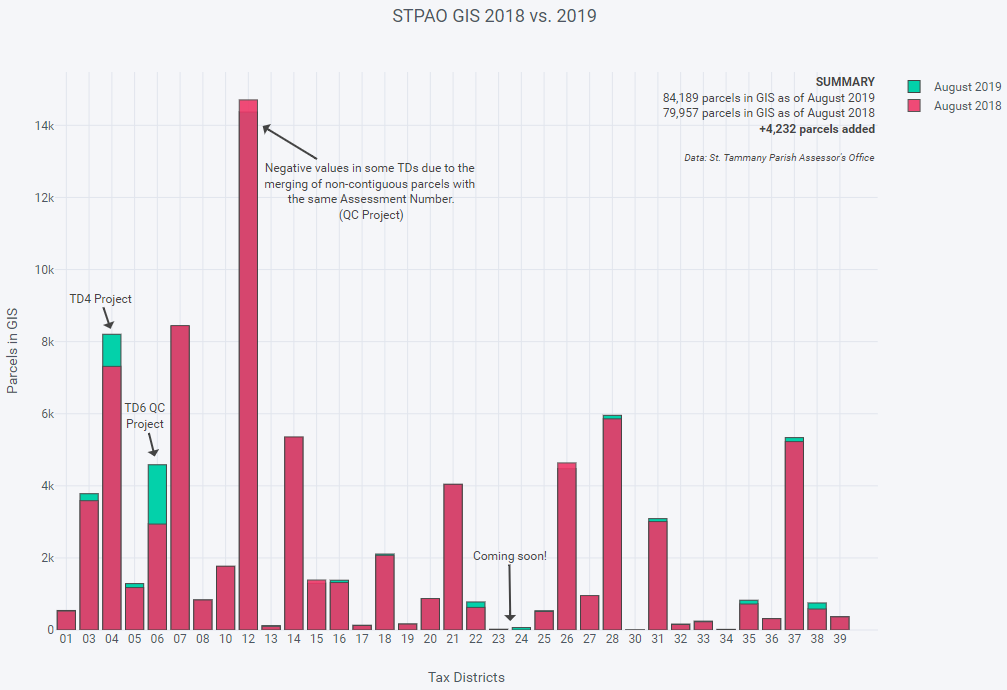
You also can view a full-sized, interactive version of this chart. (Note: It is better to view this link in Firefox than in Chrome.)Thank yous and good jobs to the GIS production team for their tremendous effort and output this past year. Karen, Fernando, Rusty, Bryan, Fran, and Brandon all have gone above and beyond to produce both quantity and quality. Well done team!
GIS PERCENT COMPLETE PER TAX DISTRICT
Here is another visualization of the state of the data in STPAO GIS:
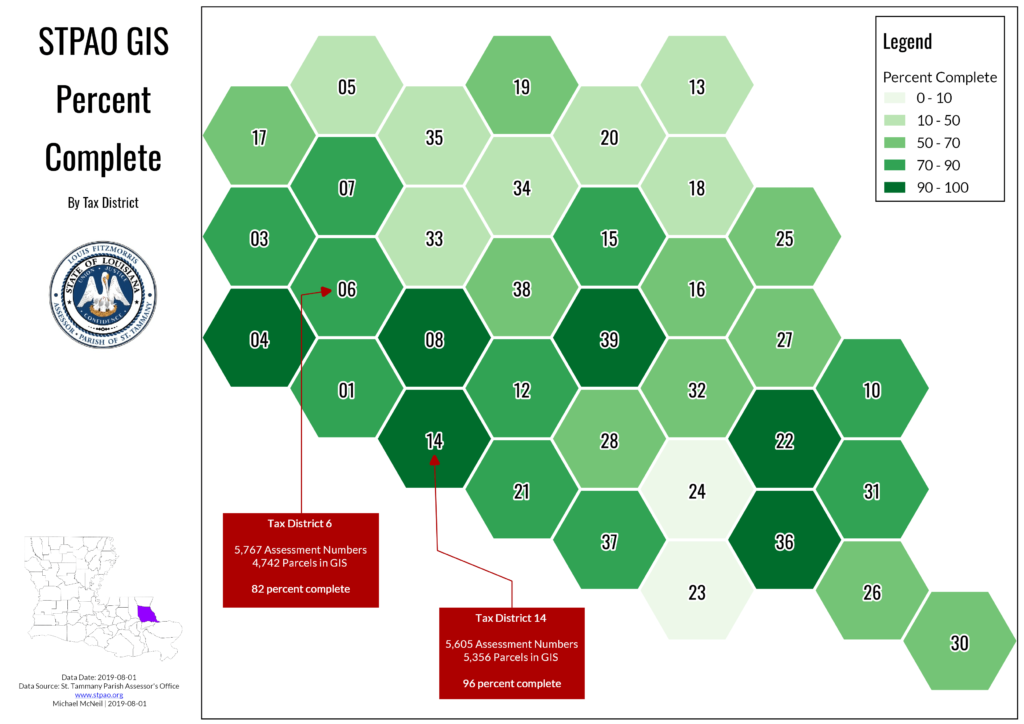
Percent complete is measured by how many on-roll Assessment Numbers starting with “1”, “4”, and “6” are drawn in GIS for a particular Tax District. For example, in Mandeville (TD 14) there are 5,605 total active Assessment Numbers in the Assessment System. Of those, 5,356 are drawn in GIS.
(5,356 / 5,605) * 100 = 96 percent.
By this measure, there now are five Tax Districts that are 90+ percent complete: TD 8, TD 14 (Mandeville), TD 22 (Pearl River), TD 36, and TD 39. The latest addition to the 90 percent club is Tax District 22, otherwise known as Pearl River. Two months ago, TD 22 was 68 percent complete. Rusty then began a project to capture Pearl River in GIS with a goal of 95 percent complete.’
As of August 1, Pearl River is at 91 percent complete.
In addition to the 90 percenters, the majority of Tax Districts are beyond 50 percent complete. The two most notable Tax Districts standing out in stark contrast to the others on the map are Tax Districts 23 and 24, also known as the City of Slidell. We hope to add these to GIS within the next year via a collaborative contracted production effort with the city that currently is underway.
For an interactive version of this chart, in which you can inspect the data for each Tax District, CLICK HERE.