St. Tammany Parish Assessor's Office Quadrennial Report

2024 Ad Valorem Property Taxes

Where Does Tax Revenue Come From?  Where Do Your Property Tax Dollars Go?

A Message from Assessor Louis Fitzmorris

Louis Fitzmorris

Louis FitzmorrisAs I present this 2024 Quadrennial Reassessment Report for St. Tammany Parish, I want to take a moment to reflect on the progress, challenges, and responsibilities that have both defined the last four years and will affect us moving forward.

This reassessment cycle was shaped by innovation and accountability. My team and I successfully implemented a modern assessment software system, substantially completed a parish-wide GIS mapping project, and deployed advanced technology that has significantly enhanced how we manage data, enforce policy, and carry out procedures. These improvements allowed us to conduct this reassessment thoroughly, efficiently, and in full compliance with the law. I am incredibly proud of my dedicated team who helped make this challenging reassessment a success.

One of the most encouraging outcomes, however, was the remarkably low number of formal appeals. Only about 100 assessments–out of more than 130,000–were sent to the Board of Review. That reflects not only the accuracy of our work, but also the fairness of the values we assigned.

I’m pleased to report that 34 of 38 taxing bodies chose to roll back their millages for 2024, delivering meaningful tax savings to property owners. Every four years, adjusted millage rates are calculated, set, and approved by the Louisiana Legislative Auditor, after which taxing agencies vote to adopt a rate anywhere between zero and their maximum authorized amount. I’m proud to share that my office has once again lowered its millage rate, and I continue to encourage all taxing bodies to demonstrate fiscal restraint and good governance.

All property taxes in Louisiana are either constitutional or approved by voters. However, in many cases, the actual decision to raise or lower your taxes is not made by the elected officials that voters might assume are responsible, but by appointed volunteers who sit on various boards and commissions. I believe it is essential that taxpayers are aware of this process and how these decisions are made. I will continue to do everything I can to keep the public informed of any tax implications as taxing bodies proceed with setting their millage rates.

While millages remain an important part of the discussion, we must also address reforms that deliver lasting relief to homeowners. One critical step is raising the Homestead Exemption. It has remained fixed at $75,000 since 1980, despite decades of inflation, rising home prices, and increasing costs of living. What once offered protection to homeowners no longer reflects the economic realities we live in today. A modernized exemption—doubled to $150,000—would better serve Louisiana’s homeowners. I have called for this change for years, and I will continue to do so on behalf of the citizens I represent. I encourage taxpayers to reach out to their legislators and voice their support for increasing the Homestead Exemption.

Transparency and service remain central to everything we do. Our office offers a full range of public services and information through our website, including GIS parcel data, assessment values, online forms for exemptions and special assessments, detailed millage histories, educational materials and videos, and online business personal property filing—in addition to the certified tax roll itself. We are committed to making the assessment process as clear and accessible as possible, and to ensuring that every taxpayer understands their rights and responsibilities. Please utilize STPAO.org and the wealth of information on it.

As always, it is my mission to serve the citizens of St. Tammany Parish with fairness, efficiency, and responsiveness. I understand that every assessment affects someone’s pocketbook, and I take that responsibility seriously. I will continue to use every tool at my disposal to deliver accurate assessments, exceptional public service, and full transparency in everything we do.

Thank you for allowing me to serve you.

2024 PERCENTAGE OF ALL REVENUE

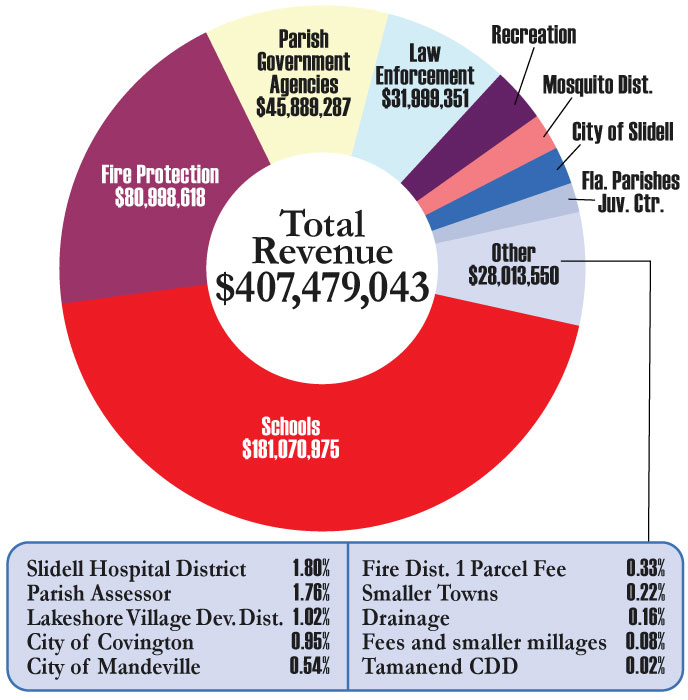
St. Tammany Parish received a total tax revenue of $407,479,043. This chart illustrates how property tax revenue in St. Tammany is divided among local taxing bodies. Many separate entities rely on their own dedicated funding streams-highlighting the complexity of our local tax structure and its impact on how public services are funded throughout the parish.

2024 Quadrennial Report - 2024 Percentage of All Revenue

$407,479,043

WHERE DOES THE REVENUE COME FROM?

Residential properties continue to generate the largest share of revenue in St. Tammany. This highlights the vital importance of fair and accurate residential assessments.

2024 Quadrennial Report - Where Does the Revenue Come From
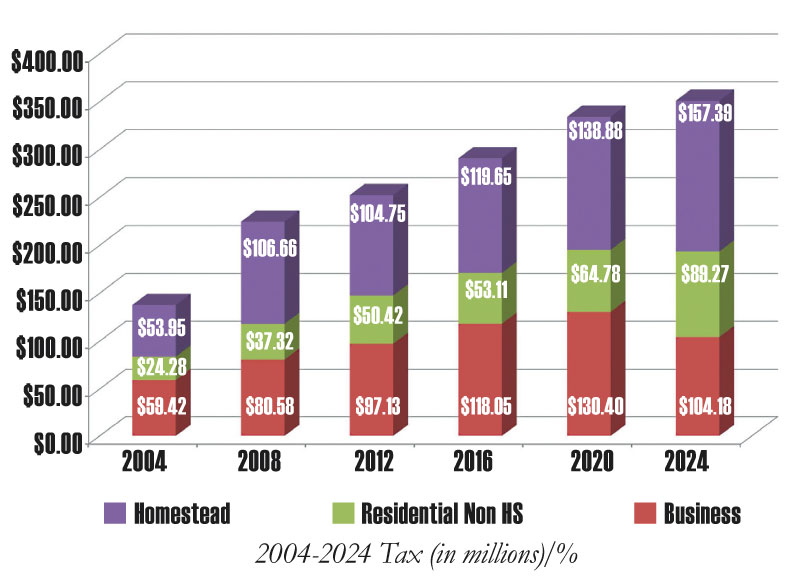
TAX BURDEN: RESIDENTIAL VS. COMMERCIAL

In Louisiana, parishes with significant industrial or commercial sectors—such as those with refineries, chemical plants, or gaming establishments—receive the bulk of their property tax revenue from commercial properties. In contrast, St. Tammany has opted not to pursue large-scale industry, placing the primary tax burden on residential property owners to support the parish’s tax base.

2024 Quadrennial Report - Tax Burden: Residential vs Commercial

Business Residential Non HS Homestead

2024 TOP PARCEL FEES

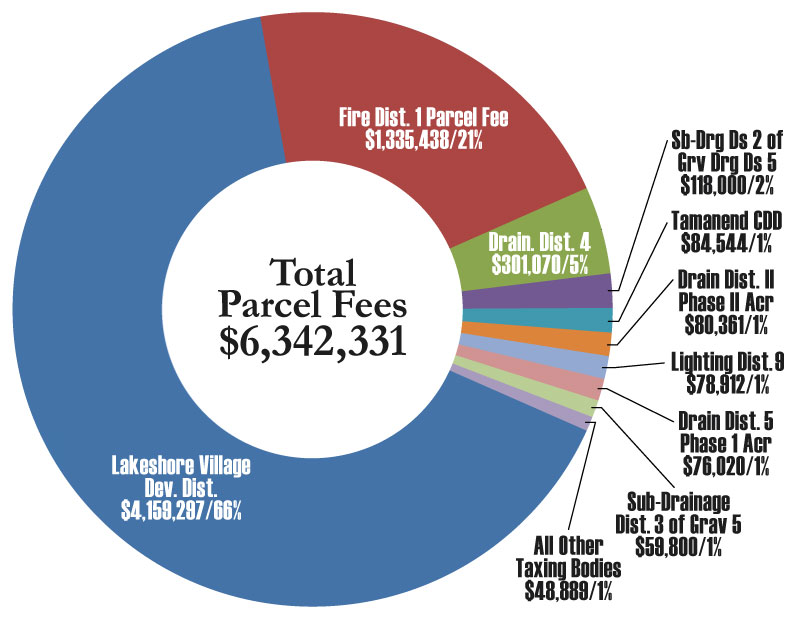
While much of the public conversation around property taxes centers on millage rates, many essential local services in St. Tammany Parish are also funded through parcel fees. These fees–levied per property or per acre—support specific services, such as drainage, lighting, and fire protection. Most parcel fees have remained steady since the last reassessment.

A few things to note:

  • Fire District 1’s parcel fee remains at $39.00 per parcel but is set to expire in 2026 and will require voter approval to continue.
  • Drainage District fees, some exceeding $250 per acre, remain unchanged.
  • Lakeshore Village and Tamanend have more complex fee structures, often linked to bond repayments or infrastructure costs. These fees can vary significantly year to year and by parcel, depending on size, location, and debt obligations.
2024 Quadrennial Report - 2024 Top Parcel Fees

Total Parcel Fees $6,342,331

WHERE DOES REVENUE GO?

Notable observations:

  • In 2024, 44.44% of all property tax revenue in St. Tammany Parish—more than $181 million– was allocated to public schools.
  • St. Tammany’s Fire Districts collectively received nearly 20% of total property tax revenue in 2024.
  • Law Enforcement received less than 8% of total property tax revenue.
  • Both public schools and law enforcement also receive funding from local sales taxes, in addition to property tax revenue.
2024 Quadrennial Report - Where Does Revenue Go

Total Revenue $407,479,043

“Other” Recipients Breakdown

2024 Quadrennial Report - Where Does Revenue Go - Other Breakdown
PARISH GOVERNMENT AGENCIES

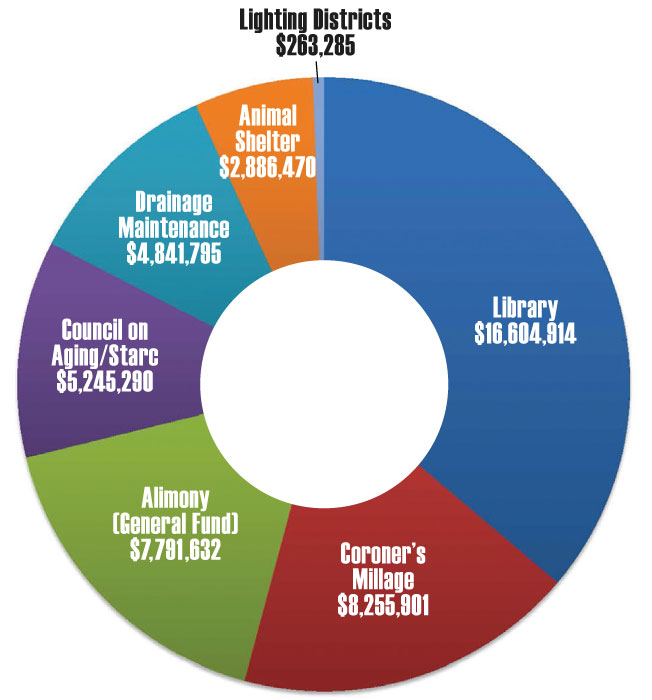
This chart shows how property tax dollars are distributed to parish government agencies— just one part of the broader tax picture. While most property tax revenue supports schools, law enforcement, and fire protection, this snapshot focuses on the nearly 12% allocated specifically to the parish, funding entities like the library, the coroner, and also the general fund.

  • Importantly, with the exception of the general fund (alimony), these are dedicated revenues. That means the tax dollars collected for each agency—such as the library, the coroner’s office, drainage maintenance, and others—are legally restricted for use only by that specific agency for its designated purpose. These funds cannot be reallocated, borrowed, or used by another agency or for a different function, even within parish government, without first obtaining voter approval through a public election.
2024 Quadrennial Report - Parish Government Agencies
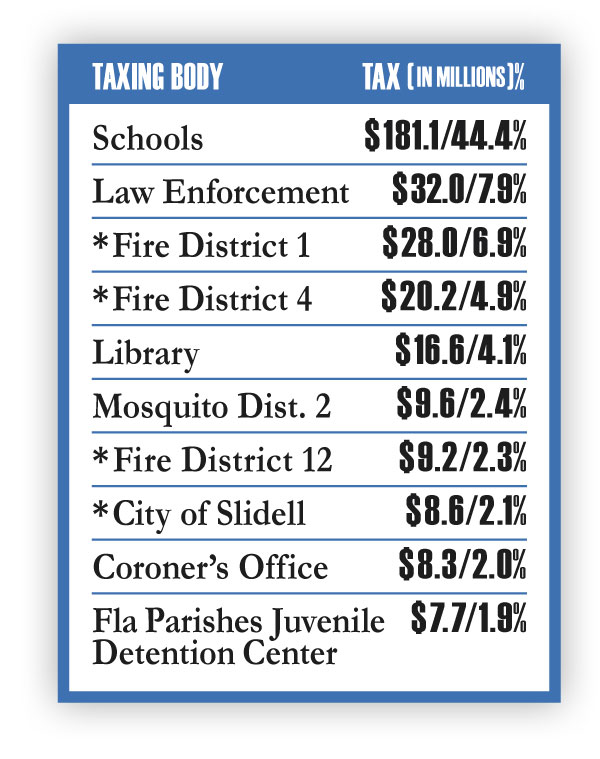
TOP TEN TAXING BODIES IN ST. TAMMANY PARISH

This illustrates the top ten taxing bodies in St. Tammany Parish by highest total property tax revenue in 2024.

A few key observations:

  • Collectively, these 10 entities account for nearly 80% of all property tax dollars parishwide.
  • The top 3 taxing bodies—Schools, Law Enforcement, and Fire District 1, together account for nearly 60% of total property tax revenue.
  • Fire District 1, serving only a portion of the parish, ranks third in total revenue collected parishwide.

*Agencies that are not parishwide and only serve specific areas within St. Tammany.

2024 Quadrennial Report - Top Ten Taxing Bodies in St Tammany Parish
FIRE DISTRICT REVENUE DISTRIBUTION

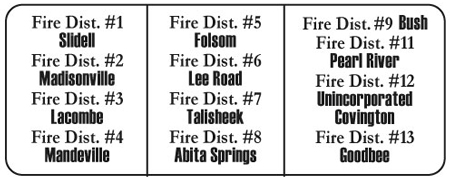
When you review this Quadrennial Report and the breakdown of how revenue is distributed, it becomes clear that not all districts are funded equally— particularly among fire districts. We have what you might call “the haves and the have-nots,” with some districts receiving significantly more funding than others.

This data illustrates how 2024 property tax revenue is distributed among St. Tammany Parish’s fire districts:

  • Fire Districts 1, 4, and 12 collectively receive 71% of total fire protection tax revenue.
  • The remaining nine districts divide the other 29%, with several receiving less than 2% each.

This visual offers insight into the wide variation in funding levels from one district to another—raising important questions about fairness, sustainability, and how best to serve all corners of our parish.

2024 Quadrennial Report - Fire District Revenue Distribution

$80,998,619

Fire District Locations

2024 Quadrennial Report - Fire District Revenue Distribution - Department Breakdown
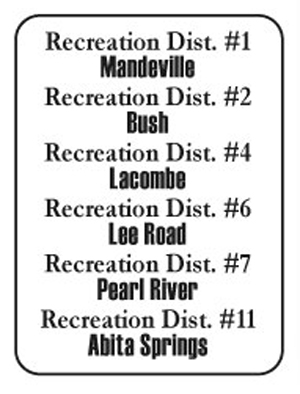
RECREATION DISTRICT HISTORY

This graphic illustrates the growth of property tax revenue dedicated to St. Tammany Parish’s recreation districts over six reassessment cycles, compared to total parishwide property tax revenue.

2024 Quadrennial Report - Recreation District History - District Breakdown
2024 Quadrennial Report - Recreation District History

Recreation Districts (millions) Total (millions) Recreation Districts Percent of Total

Click On Data Bars And Points For More Information

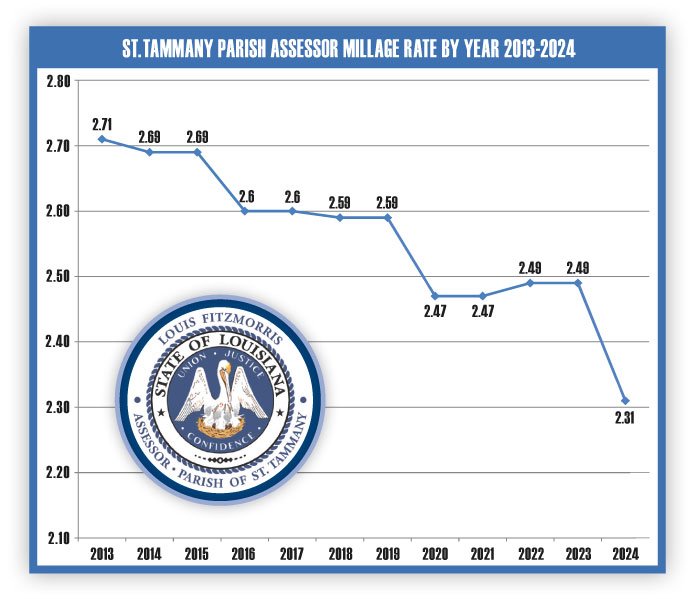
ASSESSOR MILLAGE HISTORY

This chart reflects a long-standing commitment to responsible fiscal stewardship—with the Assessor’s Office consistently making purposeful decisions to set its millage rate below the maximum allowed rate and reduce the tax burden on St. Tammany Parish property owners. We have opted to lower our mills over numerous reassessment cycles—a measured approach that has resulted in meaningful, recurring savings for taxpayers.

2024 Quadrennial Report - Assessor Millage History

Click On Data Points For More Information

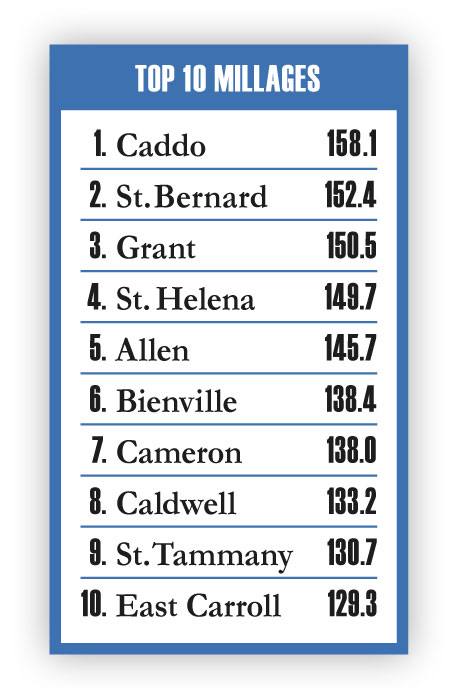
2024 TOP 10 PARISHES WEIGHTED AVERAGE MILLAGE RATES

By comparing parish millage rates across Louisiana, this snapshot provides context for how St. Tammany stacks up—and how its tax trajectory is shifting within the broader statewide landscape.

  • In 2024, St. Tammany ranked 9th highest in weighted average millage rates at 130.7 mills.
  • That’s down from 7th place in 2023, when the rate was 141.5 mills—an 8.29% decrease.
  • This marks the 5th largest percentage drop among all 64 parishes.

Despite remaining in the top ten statewide, St. Tammany’s relative tax rate position is improving, suggesting efforts toward fiscal restraint.

This pattern also signals trust in the Assessor’s revenue projections, as taxing bodies have confidence they will receive the revenues estimated without needing to roll forward their millage rates.

2024 Quadrennial Report - 2024 Top 10 Parishes Weighted Average Millage Rates
IT MATTERS WHERE YOU LIVE

In St. Tammany Parish, property taxes aren’t one-size-fits-all. The same house, with the same assessed value, can be taxed very differently depending on location—because millage rates vary by district. Some areas pay under 100 mills, while others exceed 150. Where you live directly impacts what you pay in taxes.

2024 Quadrennial Report - It Matters Where You Live
2024 MILLAGE RATES BY TAX DISTRICT
2024 Quadrennial Report - Millage Rates By Tax District
2024 Quadrennial Report - 2024 Real Estate Property Tax Notice
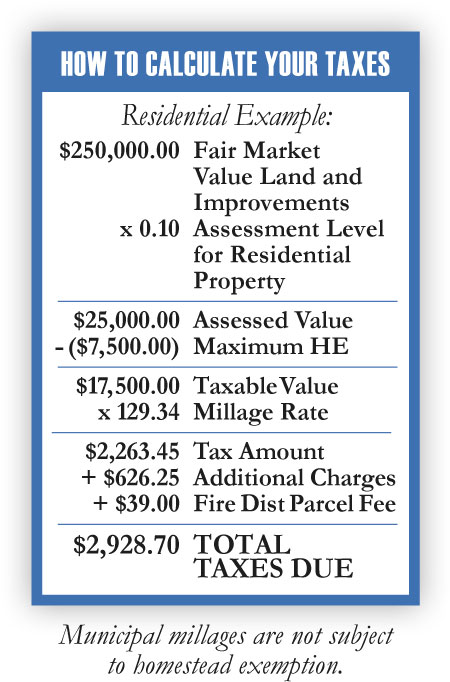
2024 Quadrennial Report - How to Calculate Your Taxes
RESIDENTIAL SALES TRENDS SINCE 2020 REASSESSMENT

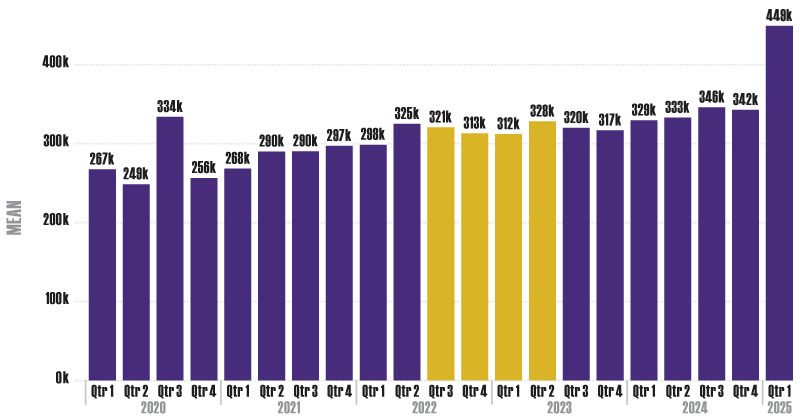
This chart shows quarterly home sale prices in St. Tammany Parish from early 2020 through the first quarter of 2025, based on qualified sales data. The yellow-highlighted section marks the state-mandated time frame established by the Louisiana Tax Commission that assessors are legally required to use when valuing property during a reassessment year. For the 2024 reassessment, this period was July 1, 2022 through June 30, 2023.

While that time frame determines assessment values, the full chart illustrates a broader trend: home prices have remained strong throughout the entire four-year span since the last reassessment, with consistent growth before, during, and after the mandated window.

2024 Quadrennial Report - Residential Sales Trends Since 2020 Reassessment
ST. TAMMANY PARISH PARCEL MAP REPORT

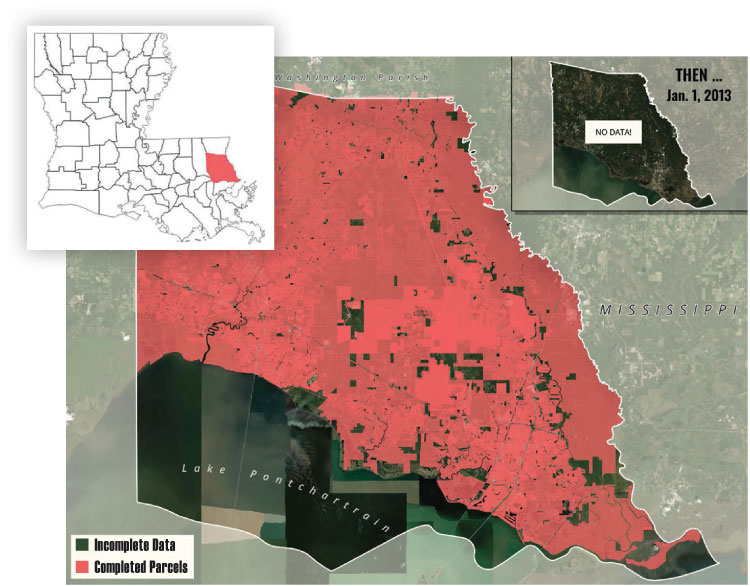
From Zero to 134,000+: Building St. Tammany’s First Complete Parcel Map

When Assessor Fitzmorris took office in 2013, the Assessor’s Office had no parcel GIS data. Since then, building this digital infrastructure has been a top priority. As of April 2025, we’re proud to report that over 134,000 ownership parcels have been identified and mapped–creating a comprehensive
and modern parcel map for all of St. Tammany Parish. This robust Geographic Information System has also elevated the accuracy and integrity of our assessment process–helping us verify property data, update records more efficiently, and deliver a more complete and equitable tax roll for the parish. We’ve made a focused investment in completing this essential task, and we share our parcel data with other St. Tammany government agencies to ensure everyone benefits. The data is also free and publicly accessible on our website.

2024 Quadrennial Report - St Tammany Parish Parcel Map Report
MILLAGE RATE TRENDS: 2012 VS 2024

Since Assessor Fitzmorris took office in 2012, nearly every taxing body in St. Tammany Parish has rolled back its millage rates—delivering measurable savings to taxpayers. However, a few chose to roll forward multiple times during that period, raising their rates and increasing taxes.

Key Observations:

  • Several of these entities— especially Fire Districts 1 and 12—also rank among the Top Ten Taxing Bodies, reflecting both high revenue collections and increased millage rates.
  • The Northshore Harbor Center and Public Health millages were eliminated entirely.
  • The widespread trend of millage rollbacks—over 70%—demonstrates responsible fiscal discipline across the parish, reducing tax burdens even as property values have increased.
  • This pattern also reflects trust in the Assessor’s projections, as taxing bodies rely on those estimates and have confidence they will receive sufficient revenue without needing to raise rates.

Net Millage Rates 2012-2024 Changes
(increase/decrease)

2024 Quadrennial Report - Millage Rate Trends: 2012 vs 2024
To Download A PDF Of The Quadrennial Report Click The Button Below