
15 Nov On The Map: 2018-11
Posted at 16:52h
in GIS Blog
In September’s newsletter, we shared a static map showing the GIS Department’s percentage complete by Tax District. It was a simple snapshot of the raw data that served its purpose as a simple report.
Now that report is an interactive web map —> https://bit.ly/2QVMxZ2
Click on the link above to check it out for yourself. You can see GIS percent complete for all Tax Districts in St. Tammany Parish by hovering over each Tax District. In addition to percent complete, you also can view total Assessment Numbers per district and the total number of Assessment parcels/points added to GIS per district.
We’ve got a few more of these maps in the works, including one that accounts for improvements added to the roll since the inception of GIS here at the STPAO. That map should be ready by December.
ALL THE BUILDING FOOTPRINTS
The New York Times produced an unfailingly incredible map of every single building in America …
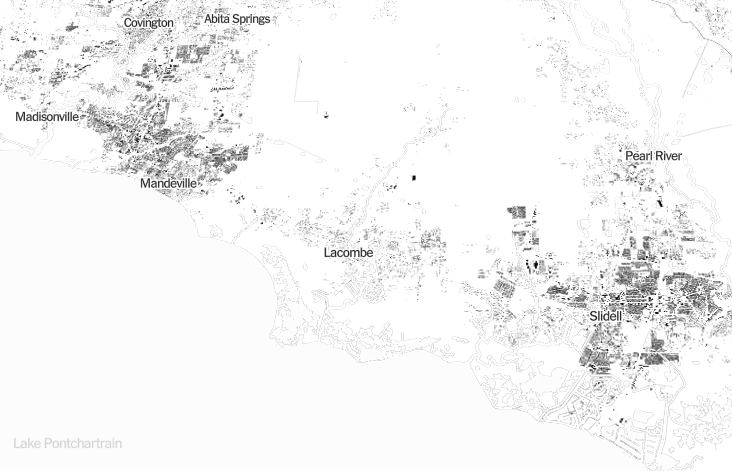
If you are interested in the nuts-and-bolts of making a map of this scale, see this breakdown here —> https://bit.ly/2AdNJBe
ANIMATED PROGRESS
We have a new animated graphic of the growth of GIS here at the STPAO …
… and yes, I’m aware that it pales in comparison to that breathtaking NYT map!